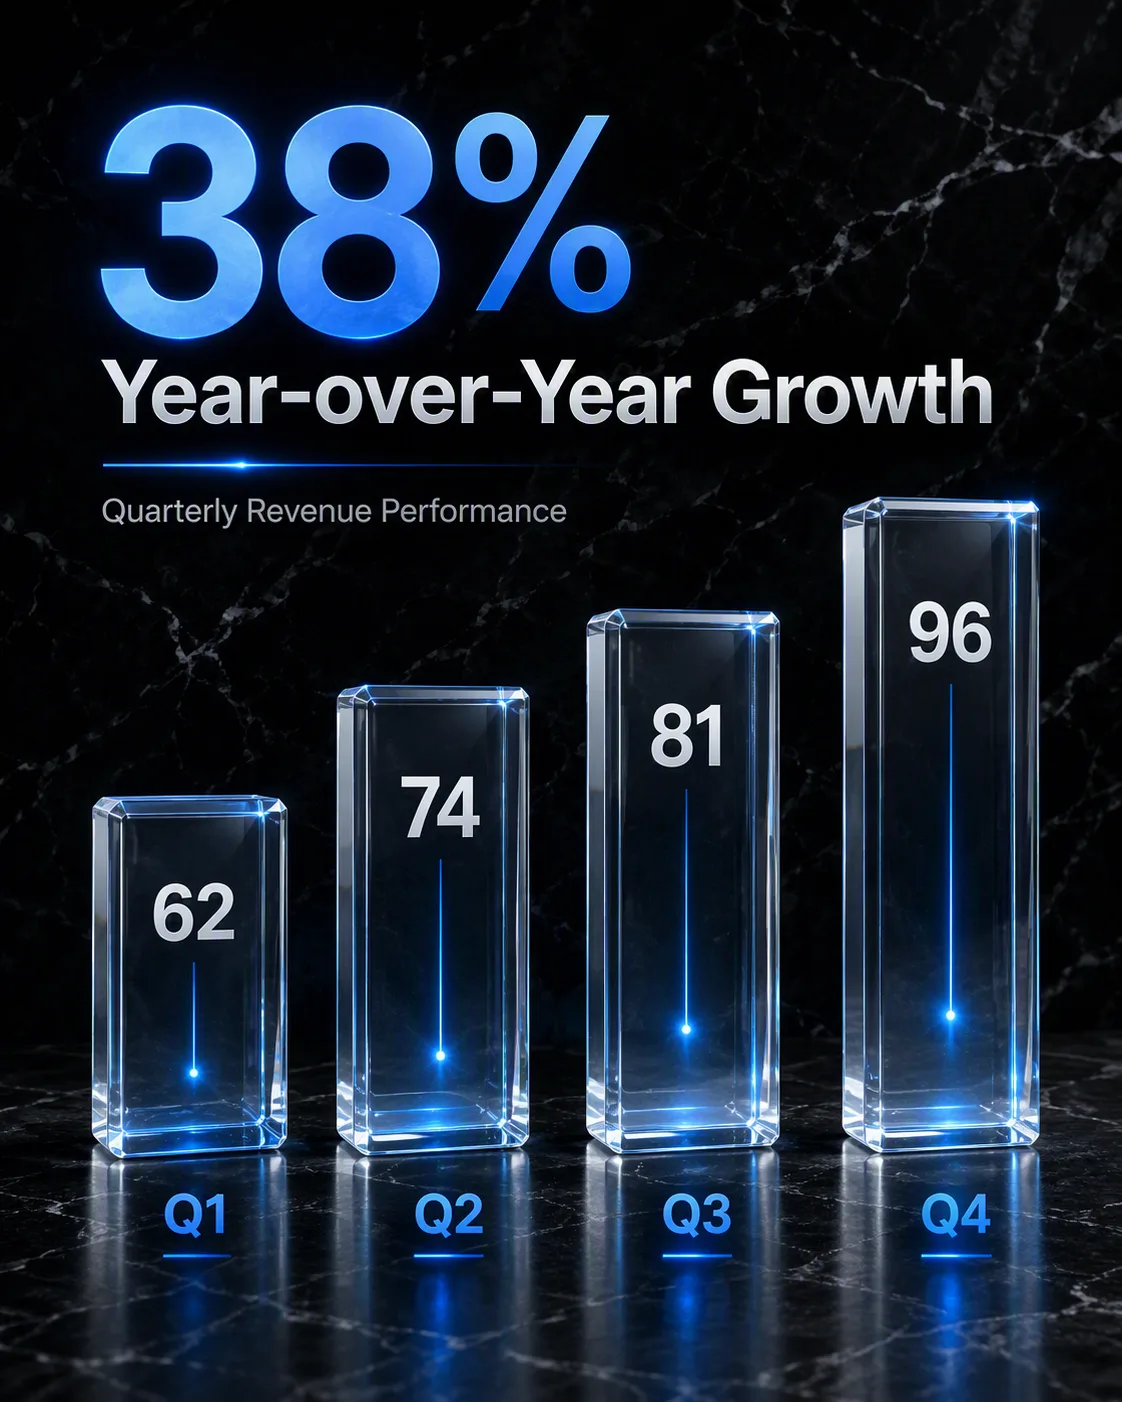
Build a high-impact quarterly report graphic around a rising bar chart made from translucent glass blocks on the Background. Shape four distinct ascending columns from the Quarterly Data, with each quarter clearly labeled and its value legible beside or within the corresponding block. Use realistic refraction, soft internal reflections and grounded shadows so the glass feels dimensional against the surface. Place the Headline Stat prominently in the upper third, with the Supporting Label directly beneath it in smaller type. Use the Color Palette throughout the glass, typography and subtle accents. Keep the composition spacious, the hierarchy immediate and the text crisp. Use bold modern sans-serif typography, strong contrast and precise alignment. Render the design in the Format. Avoid extra copy, distorted lettering, unreadable labels and decorative elements that compete with the chart.

Use these details:

Headline Stat: "38% Year-over-Year Growth"
Supporting Label: "Quarterly Revenue Performance"
Quarterly Data: ["Q1: 62", "Q2: 74", "Q3: 81", "Q4: 96"]
Color Palette: "smoky charcoal, clear glass, cool silver and electric blue"
Background: "black marble with subtle white veining"
Format: "4:5 vertical Instagram post"