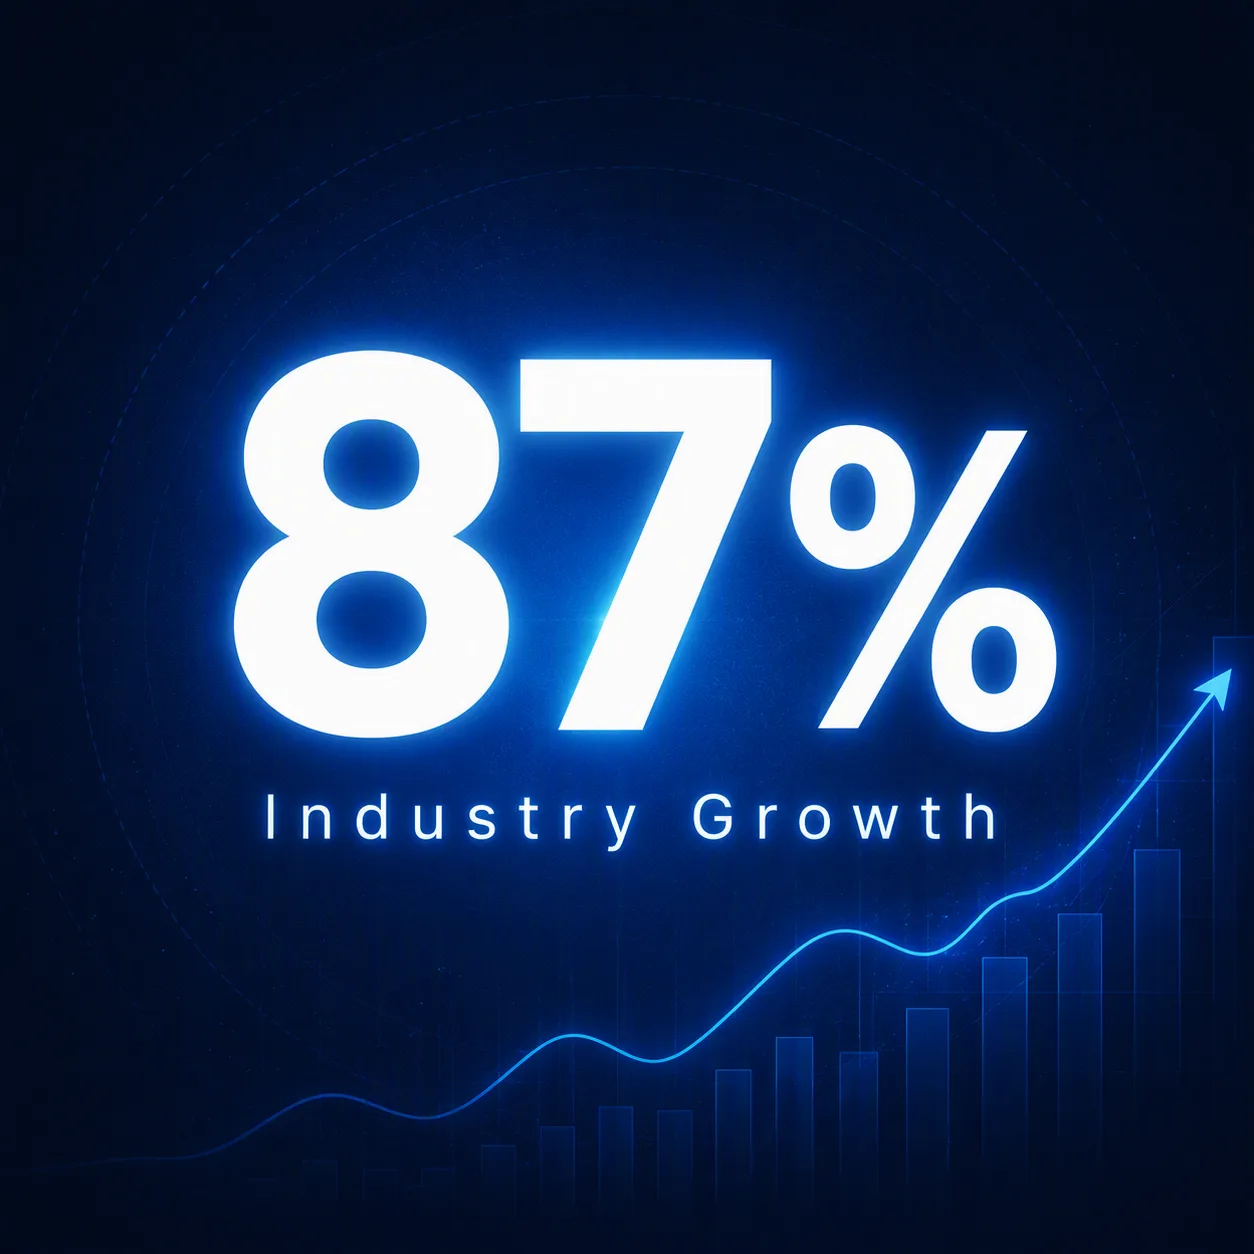
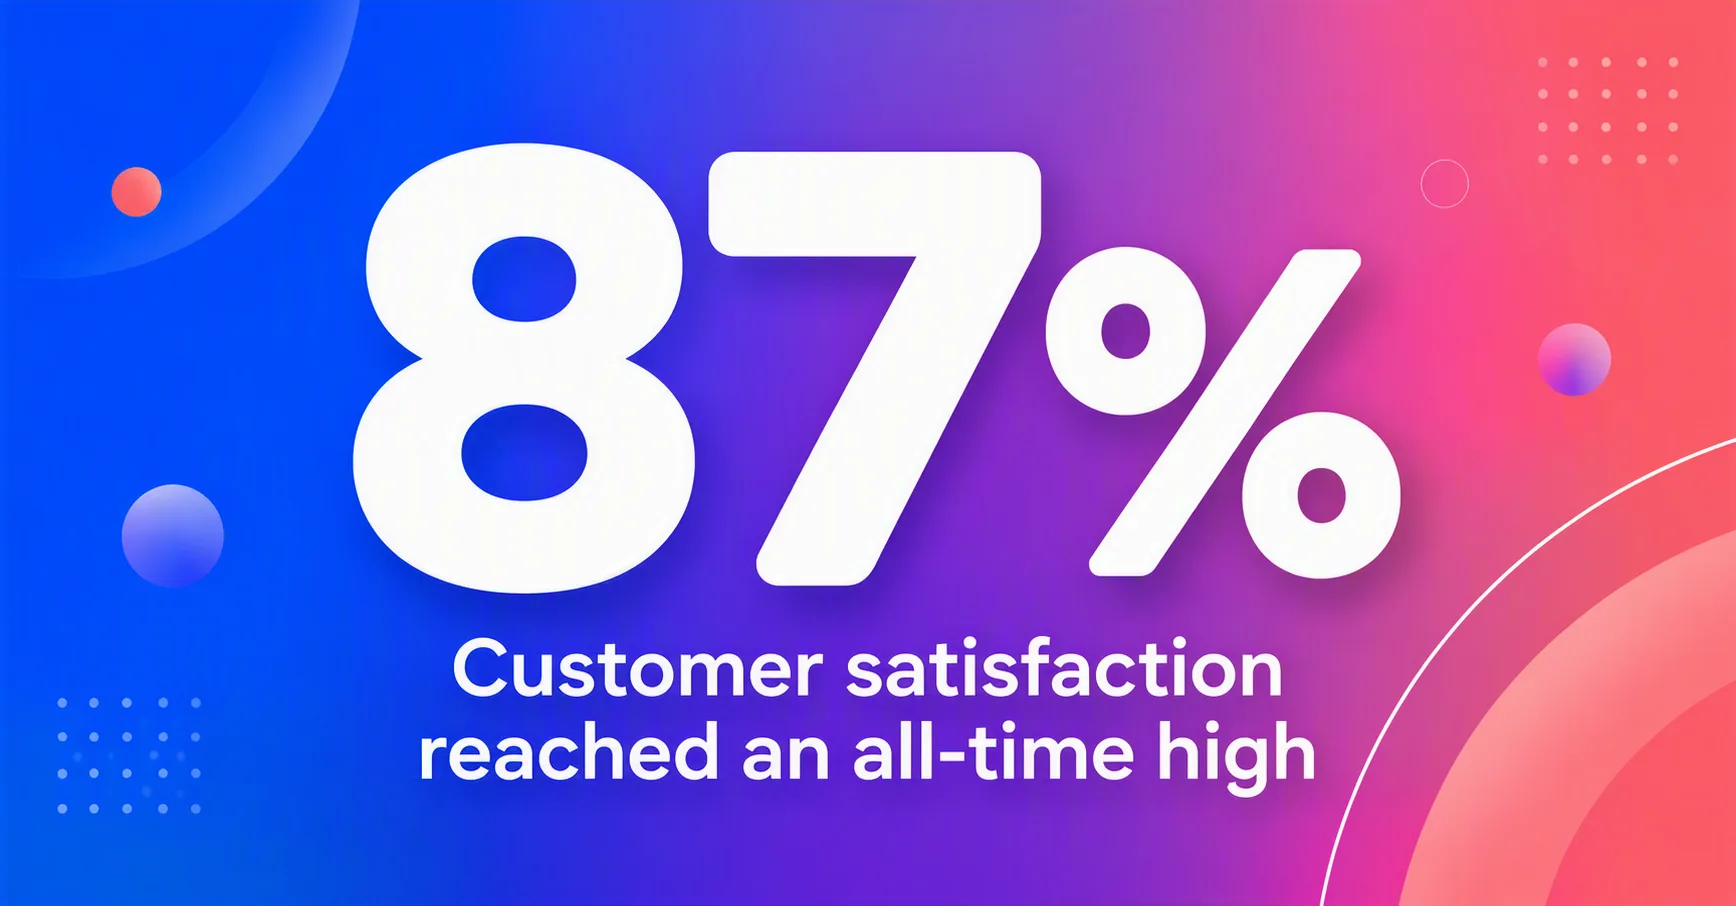
Build a bold LinkedIn statistic graphic in the Format. Center the Statistic Text as the dominant visual element, rendered exactly as written in large, heavy sans-serif typography with a soft luminous glow. Place the Supporting Text beneath it in smaller, widely tracked lettering, keeping the hierarchy clear and immediate. Use the Color Palette across a deep atmospheric background with a restrained radial glow behind the statistic, subtle grain, and barely visible geometric lines that suggest business growth without distracting from the message. Maintain generous negative space, precise alignment, crisp edges, and strong contrast for easy viewing in a social feed. The result should feel modern, confident, and suitable for an industry report or corporate marketing post. Render all text exactly as provided, with no additional words, misspellings, or decorative symbols.

Use these details:
Statistic Text: "87%"
Supporting Text: "Industry Growth"
Color Palette: "dark navy, glowing white and subtle electric blue"
Format: "1200 x 1200 square LinkedIn post"