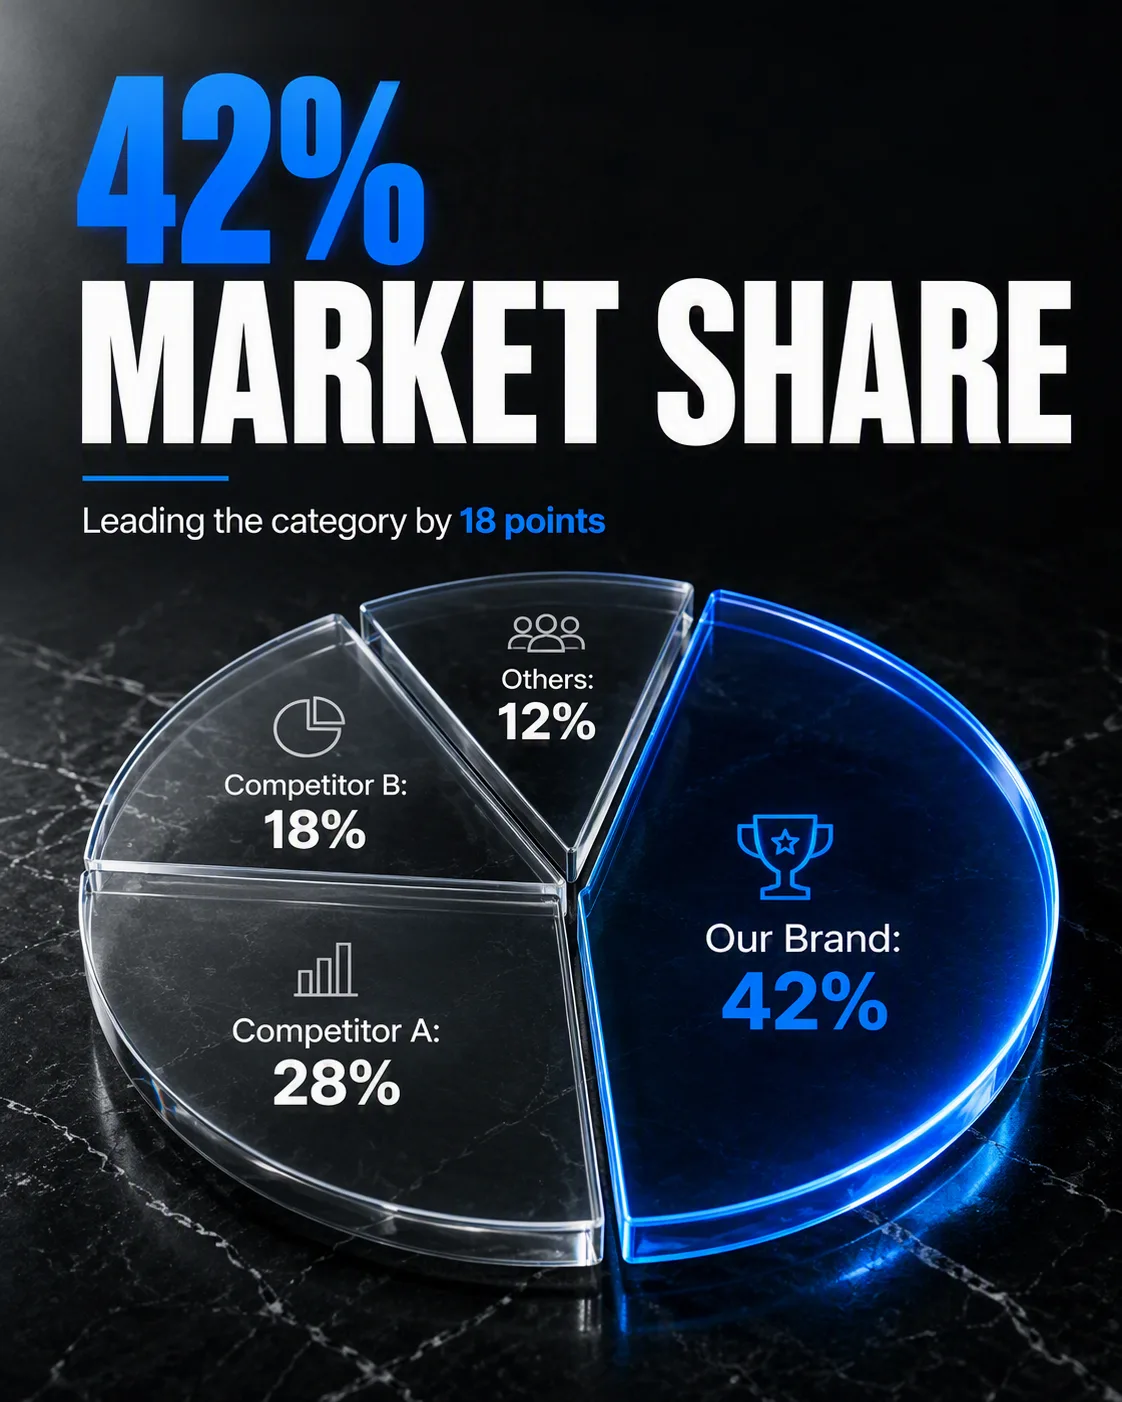
A transparent glass pie chart rests on a black marble surface in a dramatic market share statistics post. Use the Chart Segments to build the pie chart with clearly distinct proportions and slim translucent glass edges. Place the Headline prominently above or beside the chart in bold, clean sans-serif typography, rendering it exactly as written. Add the Stat Line beneath the headline as a concise supporting data point, also rendered exactly as written. Use the Color Palette across the chart sections, typography, highlights and subtle reflections. Create depth with realistic refraction, soft surface reflections and controlled studio lighting from the upper left, while keeping every chart label legible. Use a restrained charcoal background with generous negative space, crisp alignment and a sophisticated finance or business editorial feel. Format the composition for the Format. Ensure all percentages and text are spelled exactly as provided.

Use these details:
Headline: "42% MARKET SHARE"
Stat Line: "Leading the category by 18 points"
Chart Segments: ["Our Brand: 42%", "Competitor A: 28%", "Competitor B: 18%", "Others: 12%"]
Color Palette: "charcoal black, graphite gray, transparent glass, electric blue and white"
Format: "4:5 Instagram post"