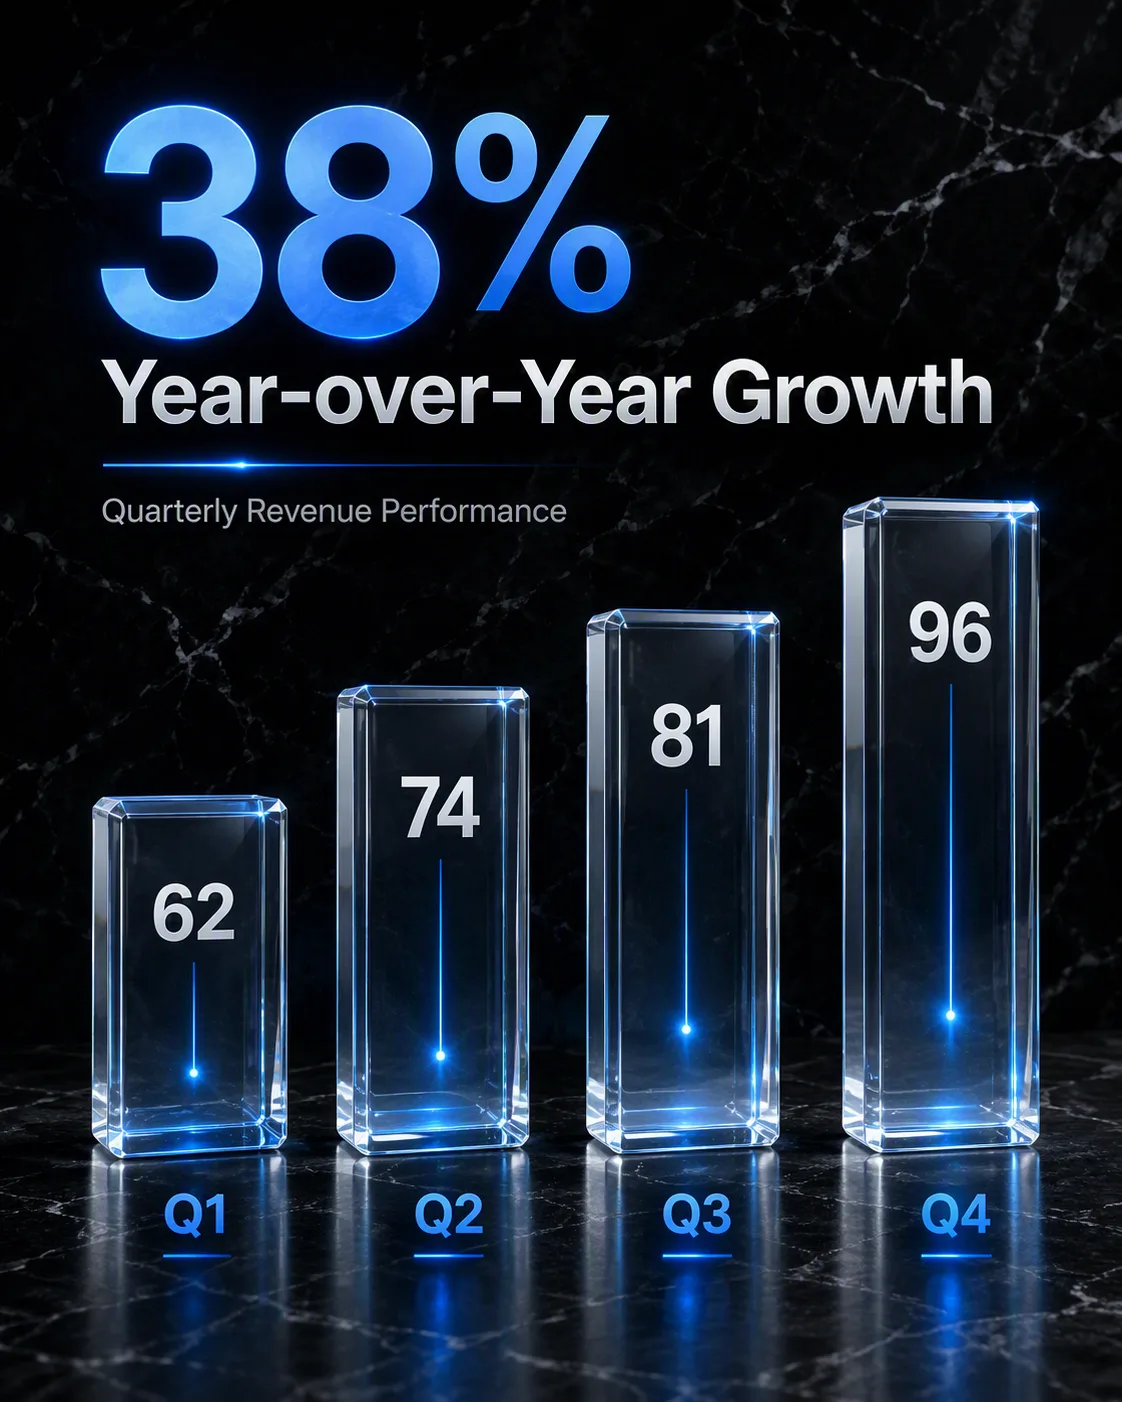
Build a finance sector stat graphic in the Format, using the Background as a dark, refined surface with visible but restrained natural veining. Place the Stat Value prominently beside a clean upward arrow icon, making both elements the immediate focal point. Set the Stat Label beneath the number in smaller, carefully spaced typography. Use the Color Palette to create strong contrast, reserving emerald green for the arrow and positive-growth accent while keeping the text crisp and highly legible. Keep the composition spacious and centered, with subtle depth from soft directional lighting across the marble. Use modern sans-serif lettering, precise alignment and a restrained editorial financial aesthetic. Render every character of the Stat Value and Stat Label exactly as written, with no extra text, logos or decorative clutter.

Use these details:
Stat Value: "27%"
Stat Label: "Year-over-year growth"
Background: "Black marble with subtle charcoal veining"
Color Palette: "Black, charcoal gray, white and emerald green"
Format: "1:1 Instagram post"
AI models never repeat themselves exactly, so your result will differ from the one here. Change the details to make it yours.